Pages

Tuesday, February 7, 2006

Foreclosures Rise / More Defaults Expected

KnowledgePlex is reporting there will be a Flood of Mortgage Defaults in the Gulf Coast as Grace Periods Expire.
Foreclosures.com, a California based investment advisory firm and nationwide publisher of distressed property information reported today that a flood of mortgage defaults could be expected in the storm ravaged Gulf Coast region. 90-day grace periods extended by many mortgage lenders expired in December.

"Borrowers could still negotiate workout solutions on a case by case basis," said ForeclosureS.com president Alexis McGee, "but they had to do it before December 1st." She added that many properties are simply gone, and that about 850,000 structures were completely destroyed or so badly damaged as to be uninhabitable.

"The impact of the hurricanes last year will distort the Gulf Coast housing market for some time," Ms. McGee said. She added that both loan originators and the secondary mortgage market were trying to accommodate borrowers suffering from hurricane related financial problems. "For example," she pointed out, "delinquencies of both mortgages and consumer debt are not being reported to credit bureaus, nor are hurricane related foreclosures."

She went on to say that the Gulf Coast housing market was strong even as defaults increase as people with insurance settlements find replacement housing, while those without insurance face foreclosure.

Ms. McGee also warned that scam artists were already at work in the devastated region. "Crooked adjusters are urging people to file bogus insurance claims for a share of the proceeds. Inexperienced and unlicensed contractors are preying on people with damaged homes, demanding money up front and then disappearing without doing the work. There have also been some suspicious house fires in cases where there was fire insurance but no flood insurance."

Foreclosures.com has been publishing foreclosure lists and assisting investors since 1992. The company expanded its foreclosure list coverage to nationwide on November 15, 2005. Ms. McGee said that they now have over 700,000 listings of distressed property in more than 900 counties across the U.S. on their website www.foreclosures.com.

"We teach our investor clients how to create win-win scenarios that benefit both the distressed owner and investor," Ms. McGee said. "The homeowner conserves some equity for a new start, and the investor realizes a reasonable profit on resale of the home. That's much better than seeing the owner lose everything in a foreclosure auction."
According to RealtyTrac's US Foreclosure Market Report National Foreclosures Increased in Every Quarter of 2005.
RealtyTrac™ the leading online marketplace for foreclosure properties, today released year-end data from its 2005 U.S. Foreclosure Market Report, which showed that 846,982 properties nationwide entered some stage of foreclosure in 2005, and a 25 percent increase in the number of new foreclosures from the first quarter to the fourth quarter.

RealtyTrac publishes the largest national database of pre-foreclosure and foreclosure properties, with more than 550,000 properties in nearly 2,000 counties across the country, and is the foreclosure data provider to MSN House & Home, Yahoo! Real Estate, AOL Real Estate and HomeGain.com.

“Overall U.S. foreclosure numbers climbed steadily over the course of the year, with more new foreclosures reported in every quarter,” said James J. Saccacio, chief executive officer of RealtyTrac. “This trend appears to be moving the real estate foreclosure market back to its historic levels.”

Saccacio noted that the number of 2005 foreclosures needed to be kept in context. “Even with almost 850,000 properties entering some stage of foreclosure across the country over the course of the year, this represents less than 1 percent of all U.S. households. And the increase in U.S. foreclosures from Q3 to Q4 was just below 5 percent.”

Report Highlights

• Despite a 29 percent decrease in new foreclosures from the first quarter to the fourth quarter, Florida documented the nation’s highest foreclosure rate and accounted for more than 14 percent of the nation’s new foreclosures in 2005. The state reported 121,843 properties entering some stage of foreclosure — 1.67 percent of the state’s households.

• New foreclosures in Colorado decreased 4 percent from the first quarter to the fourth quarter, but the state’s annual foreclosure rate ranked second highest nationwide thanks to consistently high foreclosure numbers throughout the year. A total of 29,630 Colorado properties entered some stage of foreclosure in 2005 — 1.62 percent of the state’s households.

• 1.5 percent of Utah households entered some stage of foreclosure in 2005, the nation’s third highest annual foreclosure rate. The state reported 11,536 properties entering some stage of foreclosure during the year, but new foreclosures dropped 27 percent from the first quarter to the fourth quarter.

• New foreclosures in Texas increased 54 percent from the first quarter to the fourth quarter, and the state documented the nation’s fourth highest annual foreclosure rate. A total of 115,643 Texas properties entered some stage of foreclosure in 2005 — 1.44 percent of the state’s households and more than 13 percent of the nation’s new foreclosures in 2005.

• Other states with foreclosure rates ranking among the 10 highest nationwide were Georgia, Arizona, Indiana, New Jersey, Ohio and Tennessee. All of these state documented annual foreclosure rates of at least 1 percent of total households and reported new foreclosures increasing from the first quarter to the fourth quarter

• Although their foreclosure rates ranked below the nation’s 10 highest, California, Illinois, New York and Michigan were among the 10 states reporting the most new foreclosures in 2005. California reported 61,563 properties entering some stage of foreclosure, and new foreclosures increased 16 percent from the first quarter to the fourth quarter. Illinois reported 46,723 properties entering some stage of foreclosure, and new foreclosures decreased 14 percent from the first quarter to the fourth quarter. New York reported 37,068 properties entering some stage of foreclosure, and the state reported more than twice as many new foreclosures in the fourth quarter as in the first quarter.

“Over the past few years, we’ve seen historically low mortgage rates, consistently escalating home prices and steady, strong employment,” Saccacio said. “This has translated into relatively low levels of foreclosure properties — particularly bank-owned properties. With interest rates rising and an apparent slowing of property valuations in most markets, we’ll be watching closely to see if there’s a material effect on the number of foreclosures in 2006.”
Click on the above link for a nice chart of state by state foreclosures.
I found the following snip rather interesting.

"Even with almost 850,000 properties entering some stage of foreclosure across the country over the course of the year, this represents less than 1 percent of all U.S. households. And the increase in U.S. foreclosures from Q3 to Q4 was just below 5 percent."

Is that supposed to make people happy?

1% may sound low but that means every 100th house you see will have been foreclosed in 2005. 2006 will be much worse. The bubble states have not even turned yet.

Frorida had a decrease in foreclosures of 39% and California only rose 15%. Despite a 29 percent decrease in new foreclosures from the first quarter to the fourth quarter, Florida documented the nation’s highest foreclosure rate and accounted for more than 14 percent of the nation’s new foreclosures in 2005. The state reported 121,843 properties entering some stage of foreclosure — 1.67 percent of the state’s households.

When there are mass defaults on Florida condos I expect those numbers to skyrocket. More interesting is the claim I keep hearing that Florida's economy is strong and job growth is vibrant. If the Florida economy is so vibrant why is it leading the nation in foreclosures? Where is the job growth anyway? Construction? What happens when construction heads south? It will not take much to reach the 2% level in foreclosures. If that happens, and I expect it to, 1 out of every 50 homes in Florida will go into foreclosure in 2006. Does that sound like a lot of foreclosures? It does to me.

On that note a telepathic question just came in:
Mish how are those homebuilders doing?

Good question Lets take a look at Toll Brothers.
Luxury builder TOLL Brothers Inc. reported a steep 29% decline in orders in its fiscal first quarter that ended Jan. 31 and slashed its delivery projections for 2006.

Toll tweaks forecast downward again.
Toll Brothers Inc. said Tuesday that selling houses during its fiscal first quarter was more "difficult" than a year ago and lowered its sales forecast for fiscal 2006.

It was the second time since November that the Horsham, Pa., residential developer reduced its forecast for this fiscal year and could be another indicator that the nation's housing market is losing steam after being red hot the last five years.

Toll, which was reporting preliminary results for the quarter, attributed the decline to problems finishing houses as well as a cooling of demand. The company said there have been delays in receiving certificates of occupancy, construction inspections and utility hook-ups.

Signed contracts were down 21 percent to $1.14 billion compared with the same period a year ago. Demand for new housing in a number of the markets in which it builds is softening.
Toll attributed the weakness to "Finishing Problems".
Did Toll all of a sudden forget how to finish houses and get occupancy permits and construction inspections? It would seem to me with declines in housing everywhere that there should be fewer problems getting timely inspections.

Meanwhile, things are doing so well for Centex now that they have increased their discount to $150,000.

How long will it be before we see the first $200,000 reduction for Centex? How many people that paid $150,000-$200,000 too much just a few short months ago will be tempted to walk away?

Remember that the uptick in foreclosures has just started. Now is not the time to be thinking about bottom fishing. It's a long, long way down from here for the bubble areas.

Mike Shedlock / Mish
http://globaleconomicanalysis.blogspot.com/

Sunday, February 5, 2006

The global economy has peaked this cycle

Today we will take a look at 3 countries: the US, New Zealand, and the UK.
That of course is a far cry from the world but to that you can add in a huge property bust in China that is now underway as well as a stagnant Europe (many countries) that never really got going. Europe borders on deflation and a global slowdown just might do them in. You might also consider how a slowdown in US consumer purchases will affect the world. With that thought, let's get started.

Forbes is reporting a big slump in New Zealand business confidence.
Business confidence in New Zealand has slumped to its lowest level since 1986 as nation's economic growth slows, according to the New Zealand Institute of Economic Research (NZIER) quarterly survey of business opinion

The institute said the December quarter survey suggests the economy is currently in the throes of a potentially acute slowdown

While inflation is likely to hover near the top of the Reserve Bank of New Zealand's target band of 1-3 pct annual CPI inflation or marginally above it for some time, NZIER said it believes the survey results suggest the central bank can afford to hold and then gradually loosen monetary policy during 2006 and into 2007

It said slowing domestic demand will reduce underlying inflationary pressure while further interest rate rises will exacerbate the sharpness of a downturn which is already very clearly underway

In December the Reserve Bank of New Zealand raised its official cash rate 25 basis points to 7.25 pct in an attempt to slow domestic demand and maintain the rate at the highest level among industrialized nations

Last month, NZIER said New Zealand's economic growth is likely to slow to 2.3 pct in the current year to March 2006 from 3.6 pct a year earlier, as business activity slows and domestic demand eases following two years of rising interest rates The December quarter survey showed a net 61 pct of firms expect business conditions to deteriorate over the next six months compared with 32 pct in the previous survey

Seasonally adjusted, a net 71 pct of firms are despondent compared with 34 pct in the September survey

NZIER said the sizable increase in negative sentiment in the December quarter occurred throughout all regions and all industry groups with manufacturers the most pessimistic.
US 4th Quarter GDP 2.7% annualized

MarketWatch is reporting the U.S. economy slows to below trend.
The U.S. economy grew at the slowest pace in nearly three years in the just-concluded fourth quarter, economists estimate.

Led by what could be the weakest consumer spending since 1991, the economy likely grew at about a 2.7% annual pace in the fourth quarter after 11 straight quarters of growth above 3%, economists say.

The slowdown is just what the Federal Reserve wants at this point in the business cycle. The Fed has boosted its short-term interest rate target 13 times since mid-2004 in a bid to put the brakes on the economy.

Above-trend growth has been sopping up excess capacity in the economy and leading to shortages and bottlenecks that can fuel inflation.

The Fed is expected to raise rates again on Jan. 31 and likely in March.

Few economists expect the slump to worsen significantly. For the first quarter, economists are estimating growth at 3.6%, approximately the economy's long-term potential. Most economists do see growth slowing again at the end of the year as the housing market weakens.

"The economy could get back to an above-trend rate this quarter, and that is what will matter to monetary policy makers," said Joseph LaVorgna, chief U.S. fixed income economist for Deutsche Bank.

While most economists had forecast a modest slowing in the fourth quarter, it looks as if the slump was worse than expected. At the beginning of the quarter, economists were expecting growth of about 3.2%.

Consumer spending, business investment and government spending all underperformed relative to expectations. The collapse of auto sales likely subtracted a full percentage from growth, UBS economists said.

Housing was one of the few bright spots in the fourth quarter's growth mix, along with inventory rebuilding.

"We do not believe the apparent weakness in the fourth quarter represents a clear change in the trend," said James O'Sullivan, an economist for UBS. GDP will likely slow from about 3.6% in 2005 to 3% in 2006 and 2.7% in 2007, he said.

The course of consumer spending this year is very much an open question. Some economists, such as Ian Shepherdson of High Frequency Economics, believe a sharp slowdown in housing later this year will force consumers to rein in their spending.

It's possible that consumer spending outpaced consumer's disposable incomes in 2006 for the first time since the Great Depression.

Paul Kasriel, top economist for Northern Trust, figures that $2.5 trillion of outstanding household debt will reprice at a higher interest rate this year, forcing households to devote more of their paycheck to servicing their mortgage and credit card bills.

But other economists say consumer spending will be fine this year. Household income growth should be strong enough to maintain healthy spending.

"We expect consumer spending growth to remain solid this year even as the housing market slows," said Dean Maki, economist with Barclays Capital. Most of the wealth that households extracted from their home equity was used to pay down more expensive debt, not to fund current consumption, Maki said. That would make consumer spending less vulnerable if home prices fall.
Let's dissect some quotes from that article.

"Household income growth should 'remain' strong".
The reality is that wage growth as well as job growth have both been dramatically below par throughout this entire recovery.

"Housing was one of the few bright spots in the fourth quarter's growth mix".
Seriously, where do they get this stuff? Enquiring Mish readers want to know.

No Pricing Power in the UK

Please take a look at the UK where output prices fell for 3rd straight month, the first time since Aug 2001.
Manufacturers continued to find it difficult to pass on increases in their raw material costs during December, official figures showed today.

Even though the annual rise in input prices during the month was the highest since records began in 1991, the office for National Statistics revealed that output prices fell for the third consecutive month for the first time since August 2001.

Between November and December, output prices, on a non-adjusted basis, fell by 0.2 pct. Although the fall was less than the previous month's 0.3 pct, analysts had actually predicted a 0.1 pct increase.

The subdued monthly output prices may come as a surprise to some analysts and officials at the Bank of England because of another increase in input prices, which rose 0.9 pct in December from November on a seasonally adjusted, just shy of analysts' expectations of a 1.0 pct.

On a year-on-year basis, input prices were up 17.2 pct, higher than analysts' expectations of a 15.7 pct increase. The December rise was the highest since records began in 1991.
Input prices were up 17.2% but there was no ability to pass on price increases.
Fancy that. It's a possibility only diehard deflationists would consider possible.

Record numbers call debt advisers after Christmas

The Guardian is reporting Britain cuts back on credit card habit.
Visa data shows shoppers switching to debit cards.
Record numbers call debt advisers after Christmas.

This indicates that consumers are taking on board warnings about running up too much debt. Instead, shoppers are using their debit cards for their spending.

The data from the card group coincided with news of a surge in the number of calls to debt advice lines during the first two weeks of the year as borrowers took stock after Christmas.

Meanwhile, record numbers of people were calling debt advisory services after finding they were struggling to pay back what they owe. The Consumer Credit Counselling Service took 9,310 calls in the first nine working days of the year - up almost 14% on the same period in 2005.

National Debtline also reported huge demand, receiving almost 13,000 calls between January 3 and lunchtime on Friday. The organisation admitted that the surge in demand had left it struggling to cope, with about two thirds of its calls going unanswered, although it said most people did get through on subsequent attempts.

It said it was in the process of recruiting 25 additional staff to add to the 55 employees who currently answer its phones in an attempt to meet the demand.
Property Bubbles Popping

If you missed the housing situation in China, you may wish to read:
Shanghai Housing Bubble Pops.

I also suggest watching Centex "One Day" Sales to see if they really are for "one day" only.
I doubt it.

You might wish to check out this report on San Diego housing. It came out today.
The Union Tribune is reporting House resales take a tumble in December.
San Diego County resale house prices tumbled last month by the biggest number in 18 years of record-keeping and contributed to the smallest year-to-year rise in overall prices in six years, DataQuick Information Systems reported Monday.
The median resale price for existing single-family homes dropped $15,000 from November to December to stand at $550,000, the largest month-to-month decline since DataQuick began keeping records in 1988.

Last year was the first time since 2001 that the number of home sales fell from the previous year. The total sold last year was 55,366, down 9.1 percent from 2004's 60,886. Monthly sales reports from DataQuick have showed a decline in activity on a year-over-year basis for 18 straight months.

On Thursday, the San Diego Association of Realtors, which monitors about 60 percent of the housing market, reported that properties took longer to sell in 2005 than in 2004 – lingering on the market for, on average, 62 days last year compared to 54 in 2004.

The total number of listings has been growing, reaching a peak of just over 15,000 listings in November, about five times more than at the peak of the buying frenzy in spring 2004.
Summary
  • 4th Quarter US GDP was 2.7%, a dramatic slowdown likely to continue
  • No pricing power in the UK in spite of massive rise in PPI
  • A Property bust in China
  • A Property bust beginning in the US, and spreading dramatically
  • Trichet very cautious on EU hikes as Europe lagged the world
  • Europe is just too little too late to fuel the world economy
  • Record numbers calling debt advisors after Christmas
Fueled by massive bubbles in consumer spending and housing, with both now headed down, the global economy has likely peaked this cycle. It remains to be seen how Bernanke deals with it.

Mish update: The above text was written on January 16th and previously appeared in
Whiskey and Gunpowder and HoweStreet.

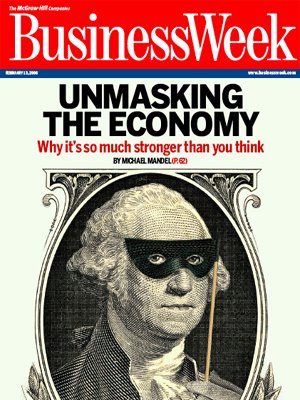
Further proof that the top is in just arrived with this BusinessWeek cover Unmasking The Economy.


Why The Economy Is A Lot Stronger Than You Think


In a knowledge-based world, the traditional measures don't tell the story. Intangibles like R&D are tracked poorly, if at all. Factor them in and everything changes.

In a knowledge-based world, traditional measures don't tell the story! Sheeesh. I wonder what Warren Buffet might think about that. This is just another version of "It's different this time". Haven't we had enough of that already?

There is nothing like magazine covers espousing some new economic nonsense to mark the top. The BusinessWeek cover is perfect.

I congratulated Time Magazine back in June for calling the top in the real estate with this silly cover.


I reported "It's Too Late" immediately after I received this Email ad:


The economy is about to be unmasked alright. It will be exposed for the house of cards that it is, completely dependent on creative financing and worsening credit lending standards, consumer debt, negative savings, and home equity extraction from houses expected to rise in price forever.

Mike Shedlock / Mish
http://globaleconomicanalysis.blogspot.com/
Friday, February 3, 2006

Time To Buy Foreclosures?

MSN real estate is suggesting it might be a good time for foreclosures if you're brave.
It might be the best time in years to buy a foreclosure home, which would mean it's perhaps the worst time for thousands of financially strapped U.S. homeowners struggling to hang onto their homes.

Many economic experts are predicting that mortgage delinquencies will rise up to 15% in 2006 among homeowners with higher-cost or "subprime" loans. About 19% of all U.S. home loans are now subprime, in contrast to just 5% 10 years ago, according to the folks at Fitch Ratings, an investment-analysis firm. A lot of those homeowners with adjustable-rate subprime loans will see their loans reset at higher interest rates in the coming months, and that will spell trouble.

The buyers are circling
Other factors expected to contribute to the default phenomenon are already-high consumer debt levels, rising energy costs and the advent of somewhat risky interest-only mortgages. So expect to see a lot of defaults on low-to-mid-level homes in 2006, although your opportunities will vary from market to market, of course.

That said, foreclosure buying is a very competitive game right now, with so many real estate gurus advocating the strategy in books and seminars, and on TV and the Internet. Just do a Web search under "foreclosure opportunities" and you'll see what I mean. Obviously, more and more buyers -- particularly investors -- are looking for an advantage in the game.

While there's not space here to go through all the strategies, buying a "pre-foreclosure" from a defaulting or financially strapped owner might be the best way to go on the consumer end. The county clerk's office keeps lists of such pre-foreclosures. Seek out titles where a "lis pendens" notice has been filed by the lender.

Be tenacious – and cautious
Before contacting and engaging in negotiations with the owners of these properties, make sure you are pre-qualified for a loan. You'll probably want to enlist a buyer's agent to make sure your best interests are represented and that you make the right offer -- which would ideally be at a below-market price.

Finding an agent with foreclosure experience would also be a plus.

The foreclosure-property auctions that you see advertised are usually the realm of more heavily bankrolled professional investors who stand ready to pay cash for a property.

If you are brave and well capitalized, you might try your hand at it. You might want to attend one or two for observation before acting. Whichever approach you try, don't give up if your first few efforts don't pan out. Eventually, your tenacity will pay off in substantial savings. Good luck and happy hunting.
Now is the best time in years to buy foreclosures?
Let's be serious. Wouldn't it have been better to buy a foreclosure in California or Florida 4 years ago and sold it last year? How can this possibly be the best time when "so many real estate gurus are advocating the strategy in books and seminars, and on TV and the Internet".

This sounds more like a top to me. Perhaps there is a bargain or two out there, especially if one has skills to do any fixing up that needs to be done, but when the "buyers are circling" and most of them are rookies that have for the most part only experienced an up market, I think the advice is like telling someone to go ahead and buy JDSU or some other stock on the first pullback in 2000. Yep, if you were quick enough many stocks bounced, even JDSU. OK you could have bought the pullback from 100 to 75 and got out at 100. But if you held JDSU is currently at $3. Real estate is a lot less liquid that JDSU was at the time.

Foreclosures Climb
The Star Telegram is reporting Home foreclosures continue to climb.
The number of homes slated for foreclosure continues to rise in Tarrant County, with 1,101 headed to auction next month. That is a 17-year high, according to Foreclosure Listing Service.

That total is up 27.6 percent from a year ago. The total of 3,583 homes facing foreclosure in Tarrant, Dallas, Denton and Collin counties is the highest since 1989, according to the Addison company.

Consumer advocates and foreclosure analysts said several factors are driving up foreclosures. Among them are rising payments on adjustable-rate mortgages, high energy costs, job losses and higher required minimum credit-card payments.

"Any one of them would be serious," said George Roddy, president of the Foreclosure Listing Service. He cited last year's changes to the federal bankruptcy law, which make filing for protection more difficult, as another possible factor. Before the change, he said, Texas homeowners often turned to bankruptcy protection to keep their homes out of foreclosure.

The number of foreclosures started edging upward a few years ago after the layoffs in the telecom and airline industries. But foreclosures have continued to rise even as the economy has improved.

"We're moving from high levels to extremely high levels," Roddy said. "There's no other reason they would jump other than the reasons I mentioned, and those reasons aren't going to change."

Analysts said rising interest rates, particularly on adjustable-rate mortgages, have forced some homeowners to give up their houses. The average interest rate hit a two-year high of 6.37 percent in November, according to Freddie Mac.

A typical ARM can increase the interest rate on a loan by 2 percentage points at once, driving the payment up by hundreds of dollars.

"The amount that [the payment] goes up over time is generally more than somebody's salary would go up," said Dara Boswell, manager of the call center for the Consumer Credit Counseling Services office in Fort Worth.

Boswell also said that many new-home buyers are not getting their taxes escrowed -- intentionally or not. Others are surprised when they get their tax bills in the year after the purchase, because their initial tax assessments included only the land, not the house, she said.

The homes will be auctioned on the Tarrant County Courthouse steps Feb. 7.
Tarrant County Auction
If someone is in the area I would be curious as to how frantic the buying is. I suspect many people will be overpaying at that auction relative to what they could get if they just went out and bought a house. How many shills will be there representing lenders that want to fetch a certain price just to get their money back? Many times you can not even inspect the homes but I do not know if that is the case for this auction or not. Buy a house with a leaking basement or roof and you have a big problem.

Housing Divide
The Dallas News is reporting a "Housing Divide" with smaller mortgages falling to foreclosures as high-end sales climb.
In a healthy local housing market, a sign of trouble has appeared: More people are losing their homes to foreclosure than at any time since the Texas real estate bust of the 1980s.

The causes run from bad luck to bad financial decisions: job loss, divorce, a health crisis, skyrocketing energy bills, out-of-control credit card debt or a mortgage payment that turned out to be unaffordable.

But there also seems to be a sharpening contrast between real estate markets at either end of the economic ladder.

As residential foreclosures jumped 30 percent from a year ago in North Texas, the average mortgage on foreclosed houses fell to $129,000, compared with almost $146,000 a year ago.

Meanwhile, home sales set records last year, with a strong 20 percent increase in sales of homes priced over $400,000.

But there was a 4 percent decrease in sales of homes priced below $110,000.

"What we're seeing develop in the marketplace is the haves and the have-nots," said Craig Jarrell, who heads up the Dallas operations of Pulaski Mortgage Co.

"Either you've got money and you've got a job and you're buying a new house and you're rocking along," he said. "Or you're underwater and can't buy a new house, and can't afford the one you're in and you're going into foreclosure."

That's not the whole picture, of course. The foreclosure hammer also recently fell on an Addison home valued at $1.5 million, a North Dallas house valued at nearly $870,000 and a Coppell property worth about $430,000.

But Connie Zetterlund, a Coldwell Banker Residential agent who specializes in foreclosed property sales, says she's noticed increasing signs of trouble at lower-priced properties.

"The price ranges are a little lower than last year," she said. "There are a ton of foreclosures out there right now."

That's not the only trend. Ms. Zetterlund has also noticed more trouble among newer mortgages, the ones acquired after the economic downturn earlier this decade.

"I'm seeing a lot of properties bought in 2004 and already going to foreclosure," she said.

In the last foreclosure boom, lenders dumped houses and it wasn't uncommon to see property values fall by 30 or 40 percent in a neighborhood, Mr. Roddy said.

Now, some real estate investors are looking at the Dallas-Fort Worth area as a place where bargains can be had for lender sales. So far, however, lenders are seeking top dollar for such homes, even if that means keeping them on the market longer, realtors say.

"We certainly haven't seen the value loss like we had in the 1980s," Mr. Roddy said. "But if the foreclosure numbers hold up like we've seen for February, it could be pretty scary."
Problems Facing Dip Buyers
Here is one problem facing the first wave of "dip buyers": Real estate investors are looking at the Dallas-Fort Worth area as a place where bargains can be had for lender sales. So far, however, lenders are seeking top dollar for such homes, even if that means keeping them on the market longer, realtors say.

Dippers dip, because that's what they were trained to do. Just as with JDSU, once the trend changes it is very tough to change one's perspective.

Another reason why this is not the dip to buy is the massive inventory of homes and the massive numbers of homes big homebuilders need to get rid of.

A 15% dip might seem attractive, until Poof - 25% Vanishes Overnight. I guess in the scenario described, one would only be 10% underwater plus commissions if one had to sell, assuming of course there was a bid.

Another problem for dip buyers is our economy seems like it is headed for a recession.
The FED seems hell bent on breaking something too. Let's see how many more hikes it takes before the FED breaks the bubble in junk bonds and credit lending. If it takes 2-3 more, what will that do to housing?

Sheriff’s Sales Rise
NewsZap is reporting a sixfold increase in sheriff’s sales.
When Kent County [Delaware] Sheriff James A. Higdon took office 11 years ago, the usual number of sheriff sales was five or six a month.

"And now it’s not unusual to have over 30," he said.
Homes are sold in sheriff sales for either tax or mortgage foreclosure.

"Today, Americans live paycheck to paycheck," said Dover real estate agent Rocke Gaston. "Look at our credit card debt, it’s atrocious. I foresee a day soon where these mortgages are given out and they’re going to regret it."

Buyer beware
Buying a property in a sheriff’s sale requires homework and a strong stomach.

"When you buy a house in a sheriff sale, it’s a risk," said Mr. Gaston, a frequent auction buyer.

It’s recommended that potential buyers research the property for liens and to make sure taxes are current. They might also drive past a property or peek inside a window, but they won’t be able to go inside the house.

The rest, the sheriff said, is at the buyer’s own risk.
"We can’t guarantee anything," he said.

A year ago, Mr. Gaston said he’d found good bargains on houses. But lately, they’ve sold for close to retail prices.

"It’s a seller’s market," he said. "Were coming to the end of it."
Foreclosures are not just a US phenomenon either. Forbes is reporting
House repossession actions surge in England & Wales in Q4 to highest in 13 yrs.
The number of actions presented by banks and building societies to repossess properties surged in the fourth quarter of 2005 to their highest level since the UK last emerged from a recession in 1993, government figures showed today.

The Department of Constitutional Affairs revealed that there were 31,018 mortgage possession actions entered during the quarter, and a total of 18,784 orders were made.

The number of actions entered were 50 pct higher than the previous year, and at their highest level since the third quarter of 1993 when the UK housing market was just emerging from one of its deepest crashes ever.

Elsewhere today, the Department of Trade and Industry revealed that the number of personal bankruptcies in England and Wales during the fourth quarter were 20,461. This was a 15 pct increase on the previous quarter and a 57.1 pct rise on a year-on-year basis.

The DTI also said the number of company liquidations during the quarter fell 5.5 pct on a quarterly basis to 3,187. However, that was 8.5 pct higher than a year ago.

'The rise in bad debt, alongside the recent slowdown in consumer credit, suggests that households are starting to feel the pressure of their rapid build-up in recent years,' said Vicky Redwood, UK economist at Capital Economics.
Home $weet Home

Real estate has now clearly peaked, worldwide, I might add. Back on June 7th, 2005 I put in a top call with help from Time Magazine. That top call was based on this:


Time Magazine went gaga over real estate on the June 12th issue, right at the very peak of the bubble. Congratulations must go out to Time Magazine for that fine achievement.

Now just 6 months later, with some areas still bubbly, MSN real estate is suggesting it is time to buy the dip in foreclosures. I have a better idea: wait until no one else wants them.

Mike Shedlock / Mish
http://globaleconomicanalysis.blogspot.com/

Thursday, February 2, 2006

political requirements of bridge met

Construction Equipment Guide seems very pleased to report
Detroit Bridge Ready for Some Football.
If you’re headed to Super Bowl XL in Detroit, MI, this February, you might be pleasantly surprised — and impressed — by Detroit’s newly completed $14-million Gateway Bridge spanning Telegraph Road along I-94 in Taylor.

The graceful twin arches join the giant Uniroyal Tire in welcoming visitors on the drive into downtown from the new Detroit Metropolitan Airport.

The Detroit Regional Gateway Advisory Council (DRGAC) — a collaboration between state and local governments and private sector investors formed in 2002 — expect the bridge to enhance the image of metro Detroit, improve the regional transportation system and provide impetus for future regional partnerships.

“These I-94 improvements will go a long way to enhance the first impressions of visitors and more accurately reflect the quality of life enjoyed by those of us who live in the Detroit region,” reported Paul Hillegonds, president of Detroit Renaissance.

DRGAC raised $1.5 million from private sector donations and grant money through Detroit Renaissance, and received a commitment of more than $7 million from the state of Michigan, plus $500,000 from the city of Taylor. Wayne County and the city of Detroit pledged a combined total of $250,000 per year to maintain the improvements.

"There was a lot of negative feedback initially,” confirmed Kim Avery of MDOT. “But the bridge really signifies cost savings. There were under-clearance issues because the beams and span are narrower than conventional bridges. Otherwise, we would have had to lower the road. That would have been more expensive with all the roadwork involved. This bridge has a thinner deck and beams."

Avery noted that private sector funds made up much of the $1.5 million price difference, and that the governor favored the plan. "He liked the savings features, and the fact that it met political requirements."

Like many other states facing budget crunches, Michigan has "put the brakes on expansion projects," she explained, "but this is considered preservation and rehabilitation."

The Gateway Bridge falls under Michigan’s "preserve first" plan.
Preserve First?
Here is a picture of what $14 million of preservation buys:


Now it's question time:
  1. Is that really an image enhancement?
  2. Even if so, is the enhancement worth $14 million?
  3. Exactly what is being "preserved" by building this bridge?
  4. Does this seem like "putting the brakes on expansion projects"?
  5. Doesn't Detroit have far more pressing problems than building a bridge shaped like a football?
  6. Doesn't the annual maintenance budget of $250,000 strike anyone as excessive?
  7. Exactly what "political requirements" were met by this design?
  8. Last but certainly not least, why should bridges have political requirements in the first place?
Mike Shedlock / Mish
http://globaleconomicanalysis.blogspot.com/

Inflation: What the heck is it?

Inflation has at least 8 distinctly different definitions that I can readily find, and probably a whole lot more that I have not yet found.

Commonly Used Definitions
  1. Decline in purchasing power of the currency held
  2. Rising prices in general (essentially the same as #1 although some might disagree)
  3. Rising consumer prices (CPI)
  4. Rising producer prices (PPI)
  5. Rising prices due to expansion of money supply
  6. Rising prices due to expansion of money supply and credit
  7. Expansion of money supply
  8. Expansion of money supply and credit
Four of those definitions refer to money supply. That brings up another issue. When one refers to "money supply" are they talking about M1, M2, MZM, Money AMS (Austrian Money Supply), or simply the amount of money they have in their bank account or wallet at the time of the conversation? Definitions 5 and 6 refer to "rising prices" yet fail to distinguish between consumer prices, producer prices, or simply prices in general. It seems we could easily add a lot more definitions.

Furthermore, some people make no distinction between money and credit but others do as noted by choices 5 thru 8. Still others insist than in the fiat world we are in, the web is so tangled between money and credit that this mess is not even worth bothering to figure out. Those folks simply hold gold and wait for "The Crash".

The thing is, it is simply impossible to argue about inflation (or anything else) unless one can agree on a definition. Like it or not, we live in a fiat world. Therefore we must attempt to have sound definitions that best describe the fiat world we are in.

A Dictionary Definition

Dictionary.com defines inflation as: A persistent increase in the level of consumer prices or a persistent decline in the purchasing power of money, caused by an increase in available currency and credit beyond the proportion of available goods and services.

One might commend dictionary.com for making the distinction between money and credit, but others might take exception to "consumer prices" vs. "prices in general", and still others might argue endlessly about what "purchasing power" means. The real problem with the definition however, is that it puts the cart before the horse.

The Cart before the Horse

The problem with definitions that have a "because of" clause is that it impossible to know exactly why prices are rising or falling. Should rising oil prices due to peak oil, geopolitical concerns, hurricanes, or other supply disruptions really constitute inflation? More to the point: Is there any possible way to decide what % of the increase in the price of oil (or anything else) was "caused by an increase in available currency and credit beyond the proportion of available goods and services"?

The answer to that latter question is easy: of course not. Furthermore, the natural state of affairs is decreasing prices because of increasing productivity (more goods produced by less labor) thereby causing a drop in prices over time. One farmer today produces as much wheat or corn as did 20 or even 100 farmers not that long ago. Unions strive to protect jobs even though one worker today produces more cars than several workers a decade ago.

Dictionary.com thus proposes a definition of inflation that simply can not be measured. The problem is the "because of" clause that puts the cart before the horse.

Is Price all that Matters?

Of course those in the "price is all that matters" camp have no such problems. To them, prices of a basket of goods and services rose, therefore inflation rose. A big problem for those in this camp is that rising asset prices (such as stock market equities) are not properly accounted for in any known basket of goods and services.

Some might argue that that problem can be solved by including stock market prices in the basket of goods and services. Unfortunately that further compounds the problem by orders of magnitude. How does one decide which stocks to include in the basket as well as the relative weighting of those stocks? Furthermore, is it really valid to call genuine improvements in business conditions "inflation"?

Even without the problem of equity assets, there is a huge problem of selecting a basket of goods and services that works for both consumers and producers. Not only is it impossible to accurately pick a representative basket of goods an services that properly measures "purchasing power", it is also impossible to make accurate quality judgments about the prices of goods in that basket.

For example: double pane insulated argon gas filled windows are now common. How does one measure the price of those windows with windows thirty years ago when such a thing did not even exist? How does one accurately measure the relative values of such windows vs. the windows of yesteryear? It simply can not be done! Practically speaking, the price drop is 100% because one could not get those windows at any price if you go back far enough.

How long ago was it that PCs, Gore-Tex, and Teflon did not exist? How does one accurately account for that? Backward price measurement comparisons are simply hopeless because of a continuous array of new product and service offerings. Some even look at such quality improvements to make a claim that the CPI is actually overstated! The ranges for overstatement that I have seen are generally 1-2% and understatement by as much as 6-7%. Can a definition of inflation that includes enormously subjective measures possibly be of use to anyone?

Is a basket that relies solely on producer prices (PPI) the answer? If so how does one properly account for rising consumer prices but not producer prices and vice versa? Obviously this line of reasoning is hopeless.

The problem of accounting for stock market fluctuations is even worse for those in the "price increases caused by an increase in available currency and credit" camp because they have to decide if stock market prices are rising or falling because of general business conditions or because of expansion of money supply, risk taking, speculation, or time preferences.

A Look Back at the New Economy

Let's take a step back from all this madness and consider the decade of the 1990's. In the mid to late 1990's money supply rose dramatically by any commonly used measure yet the folks in the "price is all that matters" and "purchasing power" camps were not alarmed because the price of oil and gold and copper and computers were falling as Greenspan became a cheerleader for the "New Economy". Can a definition of inflation that ignores such problems possibly be right?

The fatal flaw made by Greenspan and the "price is all that matters" camp is that productivity improvements led by an internet revolution, along with global wage arbitrage and outsourcing to China and India, lowered costs on manufactured goods and kept the lid on wage increases in the manufacturing sector. Those factors all helped mask rampant inflation in money supply. The Greenspan FED further compounded the problem by injecting massive amounts of money to fight a mythical Y2K dragon that simply did not exist. Those monetary injections helped fuel a massive bubble in the stock market in 2000.

Everyone in the "price is all that matters/purchasing power" camp either has to ignore equity distortions or account for them by adding equity prices to the basket of goods and services. Either way is problematic.

The Role of Government

Those in the "because of" camp also need to take account of the fact that rising prices in a basket of goods and services as well as rising equity prices often happen because of "government imposed solutions to nonexistent problems".

One can even logically argue that government itself is the primary cause of rising prices. Look no further than Y2K, a Medicaid Bill that legislates against mass purchases of drugs, congressional action that impose tariffs on crops and lumber, congressional actions that prevents drug imports from Canada, builds bridges to nowhere in Alaska, and other such nonsense.

There are now more than 200 governmental bills designed to make housing affordable. The worst of the lot were bills authorizing creation of the GSEs (Fannie Mae and Freddie Mac). Lenders eventually figured out how easy it is to dump the riskiest loans onto those quasi government agencies. Credit standards then went downhill and home prices sky rocketed.

As reported in the Washington Post article FHA Alternatives To Subprime Loans Alphonso Jackson, Housing and Urban Development Secretary actually went so far as to send this message to private sub-prime lenders: "We need to reach out to African-American, Hispanic and other first-time buyers with better loan concepts, more flexible guidelines and quicker service. I am absolutely emphatic about winning back our share of the market that has slipped away to subprime lenders."

A government desire to win back market share from private lenders is most assuredly pure insanity. Indeed, promotion of the ownership society itself is at the very heart of this mess. Supposedly the government wants "affordable housing" yet it puts into practice anti-free market policies that absolutely ensure the opposite.

Let's briefly discuss Medicare/Medicaid. Government policies prohibit negotiation of bulk discounts. Those policies also prohibit imports from Canada and other nations willing to provide drugs at a cheaper cost. The most recent boondoggle is a process whereby recipients can only change providers once a year while providers can add or drop coverage with a mere 60 days notice. Someone signing up for benefits specifically because a needed drug was covered may find out after 60 days they have to eat the entire cost. What kind of sense does any of that make?

Somehow entitlement programs always have enormous cost overruns. The Medicare/Medicaid bill is no exception. Before the bill was even passed, its costs were known to be understated by at least $139 billion dollars. The Washington Post article White House Had Role In Withholding Medicare Data notes that Richard S. Foster, the government's chief analyst of Medicare costs was threatened with firing if he disclosed the true costs of the bill to Congress. The bill passed by an extremely slim margin. Had the true costs been disclosed it is doubtful the bill would have passed.

If you are looking for a source of inflation, there is no doubt that Greenspan, the FED, and government policies are all a huge part of the problem. What is interesting is that Greenspan is now finally starting to make sense for the first time in his entire career with his recent warnings about Fannie Mae, government spending, and trade deficits. For 18 years everyone listened to "The Maestro" even though most of what he said was totally unintelligible. Now the ultimate irony is that no one is paying attention just as he is finally starting to make some sense.

We will leave this matter for another time except to point out the following: The government and the FED are both always fighting some sort of mythical dragon. That is a huge problem over time.

A Use for the CPI

Let's now return to a question I asked earlier: Can a definition of inflation that includes enormously subjective measures such as the CPI possibly be of use to anyone? Actually it can, but not to any private citizen's benefit. The basket of goods and services as well as subjective measures of quality improvements can indeed be used by the government to underpay holders of inflation protected securities like TIPS, as well as understate cost of living adjustments to social security recipients.

How many believe the government's basket of goods and services is overweight computers and appliances and underweight heating bills, medical expenses, gasoline, insurance, and housing? Even if one believes the government was honest about the makeup of the basket, is the government biased about subjective measures of quality improvement of items in that basket? The problem of baskets and weightings is simply impossible to solve. The cynical will propose it is impossible to solve on purpose.

Money vs. Credit

Because of cart before the horse problems, basket selection problems, PPI vs. CPI problems, asset price problems, and government manipulation problems, we can easily discard the first 6 widely used definitions of inflation. That leaves us with a choice between the following:
  1. A net expansion of money supply
  2. A net expansion of money supply and credit
Given the current government policies that allow tremendous leverage via the fractional reserve lending, the most logical conclusion is that it is indeed necessary to distinguish between money and credit.

Fortunately the work in this area has already been accomplished by Austrian economist Frank Shostak. In The Mystery of the Money Supply Definition Shostak makes note of the difference between money supply and credit, while making a solid case that Money Supply (elsewhere called Austrian Money Supply or Money AMS) is Cash+demand deposits with commercial banks and thrift institutions+government deposits with banks and the central bank. The difference between Money AMS and other published "money supply" figures such as M1, M2, M3, or MZM is therefore either credit, over-counting, or pure nonsense.

Before making a final decision between the two remaining definitions let's first consider a real world example: Japan 1982-2004. Some argue that Japan never went through deflation. One basis for that argument is that "money supply" as measured by M1 never contracted over a sustained period. The other argument is that prices as measured by the CPI never fell much. Once again we have a flawed argument about consumer prices and a flawed argument that only looks at money and not credit.

Although Japan was rapidly printing money, a destruction of credit was happening at a far greater pace. There was an overall contraction of credit in Japan for close to 5 consecutive years. Property values plunged for 18 consecutive years. The stock market plunged from 40,000 to 7,000. Cash was hoarded and the velocity of money collapsed. Those are classic symptoms of deflation that a proper definition incorporating both money supply and credit would readily catch. Those looking at consumer prices or monetary injections by the bank of Japan were far off the mark.

Frank Shostak nicely describes the end of such economic booms in Making Sense of Money Supply Data:

As prices of financial assets begin to rise, in order to keep their growth momentum intact the money supply rate of growth must expand. Any slowdown in the money supply rate of growth will slow the growth momentum of financial assets' prices.

Once the rate of growth slows down false activities encounter trouble. Since the diversion of real resources toward these activities slows down, a fall in the money rate of growth strangles them. It follows then that rising growth momentum of money leads to an expansion in nonwealth generating activities (also known as an economic "boom") while a fall in growth momentum undermines false activities and results in an economic bust.


Note that it was a continued collapse in credit as opposed to a collapse in government monetary printing that eventually sealed the fate in Japan. The lesson to be learned from Japan is that once the ability and/or desire of consumers and corporations to take on more debt is reached, the party is over barring and out and out hyperinflationary expansion of money. For a discussion of Ben Bernanke's hyperinflationary "helicopter drop" solution to deflation, please see Robert Blumen's article Bernanke: Foreign Savings Glut Harms the US.

In practice, a helicopter drop of money would bail out consumers at the expense of the FED. Furthermore such actions would eventually destroy the FED's own power and wealth. Logic would therefore dictate that the helicopter drop threat would not be carried out in actual practice. No doubt there will be further endless debate on this subject, one way or another, until the final collapse is at hand.

Conclusions

The logical outcome of the above discussion is that a proper definition of inflation or deflation must be built on the foundation of a sound definition of money supply that distinguishes between money itself and credit. The definition should also ensure that the horse and the cart are in their proper places.

With the above in mind:
  1. Inflation is best described as a net expansion of money supply and credit.
  2. Deflation is logically the opposite, a net contraction of money supply and credit.
  3. Government mandated solutions to problems best left to the free market is the root cause of money supply expansion.
  4. With no enforcement mechanism such as a gold standard to keep things honest, and with no desire to raise taxes, governments simply approve programs with no way to fund them. The FED has been all too willing to play along by printing the money needed for those government programs. To make matters worse, the fractional reserve lending policies of the FED allows an even greater expansion of credit on top of the money printed. Eventually those actions result in a crack-up-boom and debasement of currency.
  5. Changes in "Purchasing power" required to buy a basket of goods and services can not be accurately measured because of the need to continuously add new products to the basket, because the measurement of quality improvements on existing products is too subjective, and because it is impossible to pick a representative and properly weighted basket of goods, services, and assets in the first place. Furthermore, such measurements are highly prone to governmental manipulation at private citizen expense. Endless bickering over the CPI numbers every month should be proof enough of these allegations.
  6. Measurement of equity price fluctuations poses a particularly difficult problem for those bound and determined to put the cart before the horse as well as those that think such assets belong in any sort of basket.
  7. Price targeting by the FED is doomed to failure because a representative basket of goods and services can not be created, because prices can not properly be measured, and because price targeting puts the cart before the horse.
  8. Expansion of money supply (typically to accommodate unfunded government spending) and expansion of credit (via GSEs, fractional reserve lending, and other unsecured debt issuance) are two of the biggest problems. Targeting the outcome (prices) can not possibly be the solution.
  9. Ludwig von Mises describes the endgame brought on by reckless expansion of credit: "There is no means of avoiding the final collapse of a boom brought about by credit (debt) expansion. The alternative is only whether the crisis should come sooner as the result of a voluntary abandonment of further credit (debt) expansion, or later as a final and total catastrophe of the currency system involved."
  10. The FED should have been listening to Mises all along. Instead they have put their faith in "productivity miracles", "new paradigms", and their own hubris. Those actions have accomplished nothing other than delay the eventual day of reckoning.
Mike Shedlock / Mish
http://globaleconomicanalysis.blogspot.com/

Wednesday, February 1, 2006

Jobs and wages during the recovery

This post takes a look at the effectiveness of the Bush administration tax cuts, jobs, wages, housing, and the "Bernanke Handoff".

The charts below are thanks to the Economic Policy Institute.
Here goes:

Failure of the Bush tax cuts


Changes in tax law since 2001 reduced federal government revenue by $870 billion through September 2005. Supporters of these tax cuts have touted them as great contributors to growth in jobs and pay. But, in reality, private-sector job growth since 2001 has been disappointing, and a closer look at the new jobs created shows that federal spending—not tax cuts—are responsible for the jobs created in the past five years.

If tax cuts have created jobs at all since 2001, it will have happened in the private sector. Assuming that job growth in 2006 matches the Bush Administration's projections, the economy will have added about 2.0 million jobs to the private sector from FY2001 through FY2006. But how many of these two million jobs actually can be attributed to tax cuts and how many to increased government spending—particularly increased defense spending—in this period?


Based on Defense Department estimates of the number of private-sector jobs created by its own spending, we project that additional defense spending will account for a 1.495 million gain in private sector jobs between FY2001 and FY2006. Furthermore, increases in non-defense discretionary spending since 2001 will have added yet another 1.325 million jobs in the private sector, for a total of 2.82 million jobs created by increased government spending. Increased mandatory government spending—which is not even included in these estimates or the accompanying chart—would account for even more job creation. The mere fact that the projected job growth resulting from increased defense and other government spending exceeds the actual number of jobs projected to be added to the economy through 2006 clearly indicates that the tax cuts hardly seem plausible as the engine of the modest job growth in the economy since 2001.

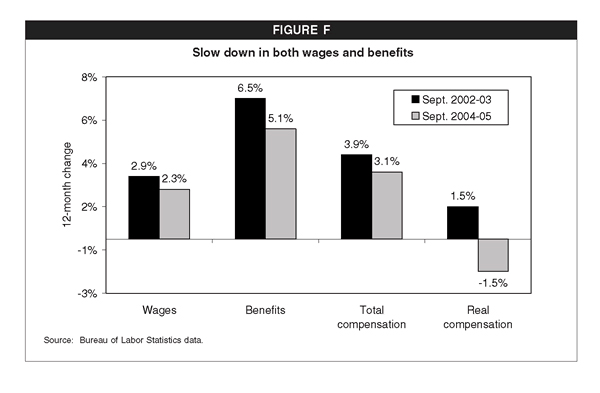
Why people are so dissatisfied with today's economy


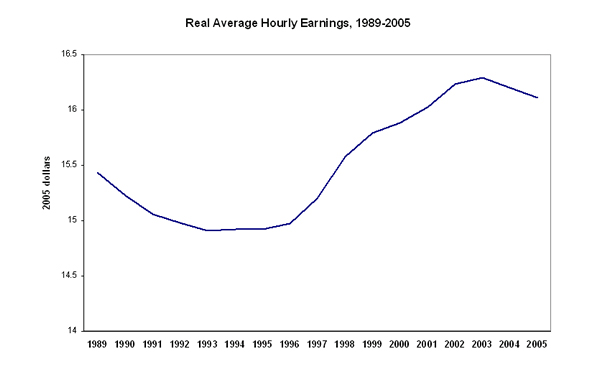
Real wages were down for the second full year in 2005
Adjusted for inflation, hourly and weekly earnings fell for most workers in 2005


Real earnings growth flat to negative in 2003
Very negative since then


Thanks again to the Economic Policy Institute.

The question is: where to from here?
Treasury secretary Snow and Bush both point to a continued recovery, but the above data suggest that is only possible if government spending picks up. Consumers are showing signs of severe stress with each and every hike. Some think that capex spending will save the day but as discussed in Thoughts on the Handover Fallacy, that seems highly unlikely.

With negative savings and cash-out refis withering on the vine, only the stock market, rising wages, or a renewed housing bubble can save consumer spending. The latter two choices seem unlikely. Global wage arbitrage is still putting severe pressure on wages and benefits.

Housing itself is like a supertanker. Supertankers are very slow to change direction, and once they do, much harder still to immediately turn back around. The housing supertanker has now turned. The top is in.

That leaves the stock market. Unfortunately for stock market hopefuls there are a multitude of problems:
  • Studies suggest consumers are more likely to spend housing gains than stock market gains.
  • A flat to negative yield curve is not conducive to corporate earnings growth.
  • This recovery is actually quite long by historical standards.
  • The second year election cycle suggests a slowdown.
  • Global wage arbitrage and outsourcing still seem to be going strong.
  • A cutback in Iraq war spending is now underway.
  • Energy and medical expenses continue to cut into consumer discretionary consumer spending.
  • 1/3 of the houses sold in 2004 were second home or for investment. That is not sustainable.
  • Housing fire sales such as housing fire sales suggest declining consumer speculation. Those are on top of Poof - 25% Underwater Overnight fire sales.
Just as the stock market went irrationally higher in Spring of 2000, it could be doing the same once again. The blowoff stages of credit expansion are upon us. Once credit contraction starts the FED will be powerless to stop it. Bernanke's test is coming up soon. He gets to face declining wages, falling home prices, rising gold and oil prices, no letup in outsourcing, but increased corporate speculation via leveraged buyouts, mergers, spinoffs, and buybacks. Greenspan successfully passed the baton. What will Bernanke do with it?

Mike Shedlock / Mish
http://globaleconomicanalysis.blogspot.com/

Monday, January 30, 2006

Thoughts on the Handover Fallacy

Stephen Roach had a nice article today called The Handover Fallacy.

Point by point Roach dismisses the idea that there is going to be a smooth transition from US consumer spending to spending elsewhere that will drive the world economy forward. I do not buy that idea and neither does Roach. Let's tune in.

Fallacy #1 - The Capex Handover

Roach:
The capex handover is at the top of everyone’s list these days. That’s especially the case with respect to the US economy. There is a presumption that consumer fatigue is about to give way to support from the business sector. Awash in record cash flow and profitability, the wherewithal of Corporate America to spend on new plant, software, and equipment has never been greater. And so, there is hope that the baton of economic leadership is likely to be passed from consumption to capex -- a seamless transition that could well lead to another upside surprise for US economic growth.

The anemic pace of consumer demand in the final period of 2005 was even weaker than that recorded in the aftermath of 9/11 and, in fact, was the second weakest quarter of consumption growth of the past decade. If this is, in fact, the beginning of the end for the wealth-dependent American consumer -- hardly idle conjecture as the housing sector now starts to roll over -- hopes for a capex handover may be dashed.

Mish:
Given that consumer spending is 70% of GDP, exactly why should businesses be expanding production if consumer spending slows? It idea is as silly as it is pervasive. Instead we are likely to see share buybacks, IPOs, mergers and acquisitions, leveraged buyouts, and spinoffs in a foolish attempt to drive prices higher. This is similar to what happened in Spring of 2000 and it is happening again. Stock buybacks and acquisitions at these prices, while staring at an inverted yield curve and likely recession is silly. Yet history is repeating.

Fallacy #2 - China, Japan, and Europe demand will replace US demand.

Roach:
Don’t count on it -- the arithmetic of this particular handover is daunting. US consumption totaled $8.7 trillion in 2005 -- about 25% greater than European consumption (at market exchange rates), 3.3 times the level of Japanese consumer demand, 8-9 times the size of Chinese consumption (depending on data revisions), and fully 20 times the size of overall consumer spending in India. That means it would be a tall order for any one of these economies to compensate for a shortfall in US consumer demand. The bottom line is that an imminent slowing of the American consumer probably spells a weakening of global consumption and world GDP growth.

Mish: It is nearly impossible to tell anyone aware of "The China Story" that China's demand is all that matters. Yet much of that demand from China is to produce goods for the US. There is no doubt that China is the growth story, but there is also no doubt that China is not yet fully prepared for a smooth baton handoff. Based on negative savings rates and a likely sustained drop in home prices, US consumer spending fueled by cash out refis and home equity lines of credit is about to fall dramatically. There is no way China can pick up the slack. Furthermore the UK consumer seems to be in the same boat as the US consumer. That makes the downside risk all the more precarious. On the basis of demographics, Europe and Japan are simply not going to pick up the slack either. Long term China remains the story, short term don't be so sure.

Fallacy #3 - A handover from an asset to an income driven US economy will save the day

Roach:
It’s a neat theory, but it won’t work as long as America’s private sector labor income generation remains decidedly subpar. In my view it would take a reversal of the global labor arbitrage -- and a related unwinding of many of the powerful forces of globalization that are driving it -- to kick-start America’s internal income-generating capacity. Barring an unlikely outbreak of protectionism, the odds of a shift away from globalization are low. That suggests that the pressures on US labor income growth are likely to remain intense for years to come.

Mish:
I have been asked time and time again: "What will it take for you to change your deflationary outlook?" My answer has not once changed changed: "Rising US wages and significant US job expansion". I see little likelihood of this happening anytime soon. Furthermore, unlike Roach, I disagree that protectionism will do anything but make matters worse. Surely Roach is aware of the problems caused by the Smoot Hawley Tariffs in the 1930's. Protectionism is bound to throw more people out of work than any supposed benefit from increased wages.

Fallacy #4 - There will be a smooth transition from the Greenspan Fed to a Bernanke FED

Roach:
The Maestro turns over his baton to Ben Bernanke this week. Many argue that forward-looking financial markets have already discounted any risks associated with this historic event. With unusually tight credit spreads and low equity volatility pointing to an absence of risk in the price of risky assets, I find that assessment hard to buy. But I also think it misses the basic point of what this changing of the guard at the world’s most important central bank is all about. When he leaves his office on 31 January, Alan Greenspan will take his books, his papers, and his pictures off the wall. But the most important thing he will take with him will be the nearly 18 1/2 years of confidence that he has earned in the financial markets. Ben Bernanke walks in the next day as a very smart and talented man -- but with a clean slate on the confidence front. As I have noted previously, financial markets have an uncanny knack of quickly testing a new Fed chairman (See my 7 October 2005 dispatch, "Transition Curse"). This is not a handover to take lightly either.

Mish:
The problems facing Bernanke are simply impossible to resolve. Greenspan is leaving Bernanke with a housing bubble, a junk bond bubble, an enormous baby boomer time bomb, a Congress intent on cutting taxes and overspending, staggering budget deficits, staggering balance of trade issues, and growing threats of protectionism. Bernanke's writings prove he does not have a clue about the real cause of the great depression even though he is facing the greatest global economic set of problems since 1928. Bernanke has to face a Congress and president unlikely to bow to his every thought like they did Greenspan. Finally and most importantly, Bernanke unlike Greenspan does not have an internet boom or a housing boom to bail out his mistakes.

There is no "handover" to be had.

Mike Shedlock / Mish
http://globaleconomicanalysis.blogspot.com/